MSPlot
Msplot is visualisation tool for massif, which is the memory usage analysation tool of
Valgrind.
It is currently in a very early stage, but still might be useful.
usage.txt
download here
Screenshots
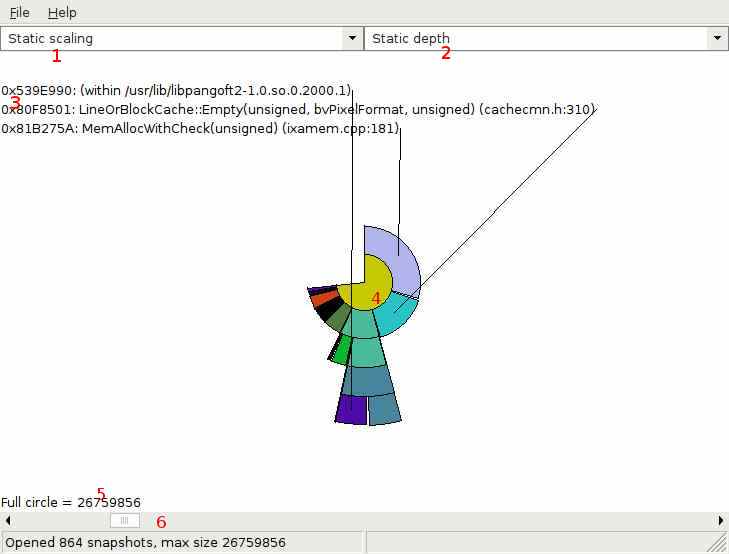
A screenshot of what msplot looks like.
- 1. Here you can choose the scaling mode. Dynamic scaling makes each snapshot use a full circle,
static scaling draws all snapshots on the same circular scale.
- 2. here you can select how many stacktrace levels are displayed
- 3. The names of the functions whose segment you clicked
- 4. A pie-chart of how the memory is allocated in your program. The center ring represents malloc/new etc.
The ring around that shows which functions have called malloc/new, and the next ring show which functions have called these functions etc. etc.
the segment angular size is proportional to the amount of memory allocated from each function.
- 5. The umount of memory corresponding to the full circle, in bytes. So the full circle represents about 25 MB, of which a little less than 3/4 is allocated at this snapshot. Because 'static scaling' is selected at 1, the full circle will be the max amount of memory the program allocted during it's lifetime
- 6. With this scrollbar you can scroll through the snapshots, so you can watch the memory your program allocated over time
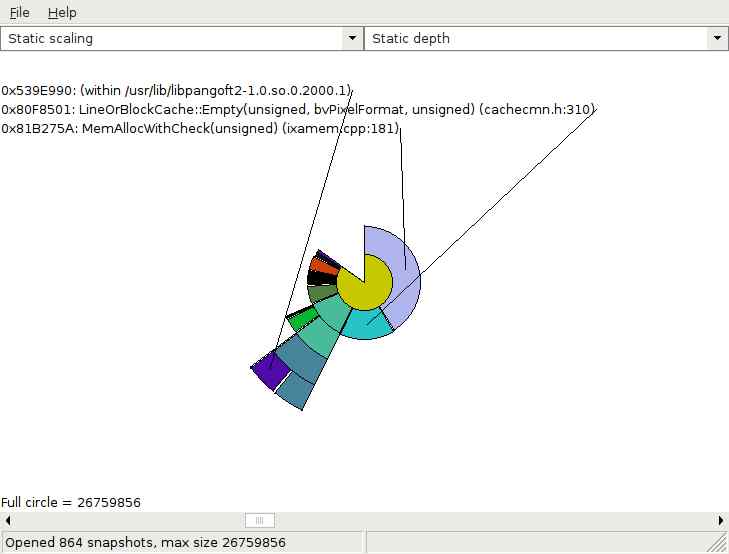
A screenshot of the same program being analyzed, but scrolled to a later snapshot. You can see the LineOrBlockCache function allocated more mem at this point in time.